Friday, April 29, 2022

Module 6 Isarithmic Mapping


 In this lab we worked with Isarithic Maps. More specifically we created a map that showed the annual precipitation and how it relates to elevation in the state of Washington. This was done using the PRISM model created by Oregon State University that is able to accurately create a grid out of the study area and use digital elevation models to fill in the each grid location to create map like the one I created above. In addition we use hypsometric tinting and continuous tone to show the elevation and its effects on the study area with contour lines clearly separating the zones.

Sunday, April 24, 2022

Module 5 Choropleth


For this lab I worked with Choropleth Maps which show the how data is distributed in certain areas. For this map we worked with Population Density and Wine Consumption in Europe. I created the map using concepts like proper symbolization and typography. In addition I used proper data classification to accurately display the data in a manner that shows the distribution appropriately. 

Saturday, April 16, 2022

Module 4 Data Classification


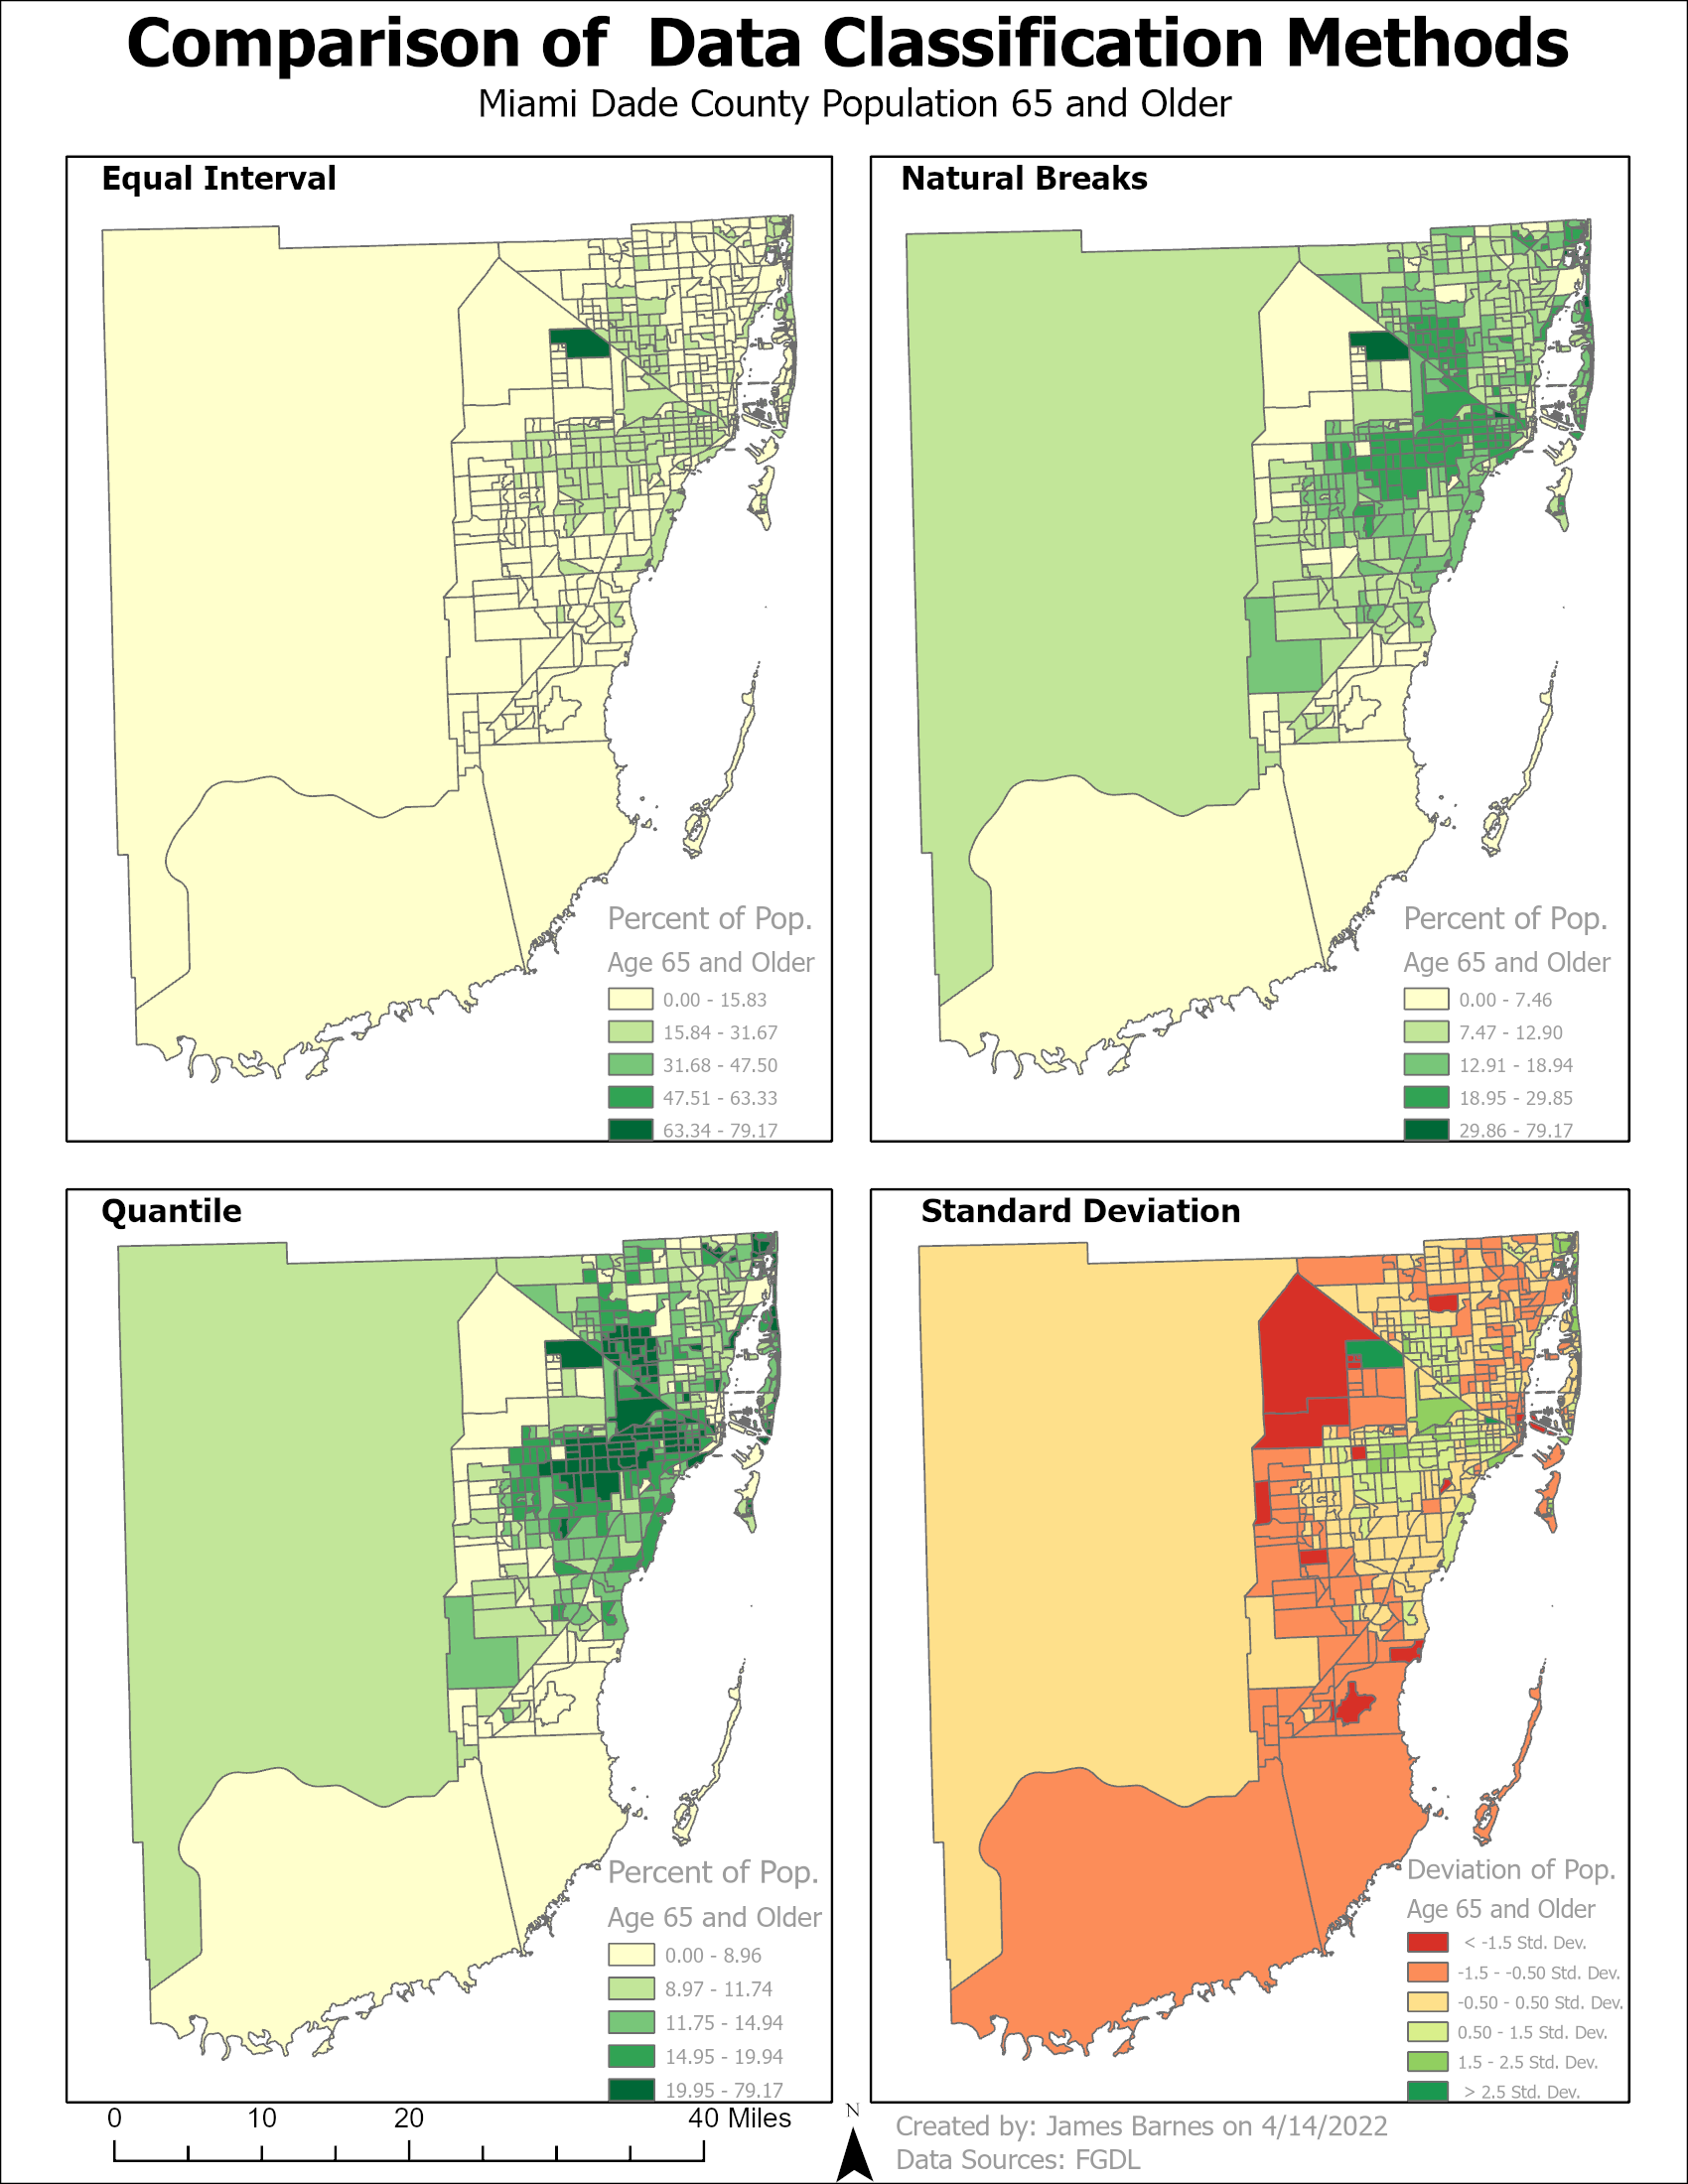
For this Module we worked on using different types of data classification specifically Equal Interval, Natural Breaks, Standard Deviation, and Quantile. We learned the pros and cons of each classification type and how they affect the data when displayed on the maps below. We created two maps based on the senior (age 65 and up) population of Miami Dade county one that showed the four classifications with just the percentage of the target demographic in each census tract and the other normalized by area to show the concertation of the targeted group in the county and how each classification affected it. 


Friday, April 8, 2022

Module 3 Cartographic Design

In this lab we were task to use some of the most basic but also the most important principles of Cartographic design. Some of these principles include balance, contrast, and visual hierarchy which all help to assist the reader to determine the purpose of the map and understand where it is. To begin the process of applying the principles I first had to add all the data that was needed then edit the size and color to show the visual hierarchy and contrast between the items and the background. This was all done in ArcGIS and the only challenging part of the assignment was trying to make sure all the details fit nicely and constantly editing the details to see how they looked. 


Tuesday, March 29, 2022

Module 2 Typography


 For this lab we world with how to properly label layers in ArcGIS Pro and how to edit those labels to reflect the cartographic rules for typography. We used the label features button and tab to control the attributes of the labels and edit them to suit the typographic norms. In my map I customized the Swamps, Capital, and County Layers in order to make them stand out since they were some of the primary objects of the lab.

Wednesday, March 23, 2022

Module 1 Map Critique

For this module we went over the basic principles of maps. This included the elements like theme, titles, design etc. and in the lab we chose a good example and a bad one in order to test our understanding of the principles we learned. Below is my bad and good  example respectfully and you can see son stark differences like the how the bad map is really disorganized and has map elements all over the place with no real plan while the good map has its elements neatly organized and they are clearly visible.  


Saturday, March 12, 2022

About me Blog Post

 Hello my name is James Barnes but I go by my middle name. Brian. I am 27 years old and I work full time for the Air Force and I am a graduate student trying to get my masters in GIS. I have academic and professional experience with GIS since I studied it during my undergraduate degree and I worked as a GIS Technician at Gulf Power. Additionally during my free time I worked on several GIS certifications to expand my knowledge and skills. I think the goals from this course would be to start networking with fellow students and also improve my GIS knowledge and experience. I joined this program in order to become more proficient in GIS and explore the possible career opportunities in this field. Some adjectives that describe me are loyal, kind, and curious.

Link for Map:

https://arcg.is/0b8Wnm1

LAB 6 Scale Effect and Spatial Data Aggregation

In regards to the effects of scale on vector data I learned that as the larger the scale the larger the units that are measured come out to ...