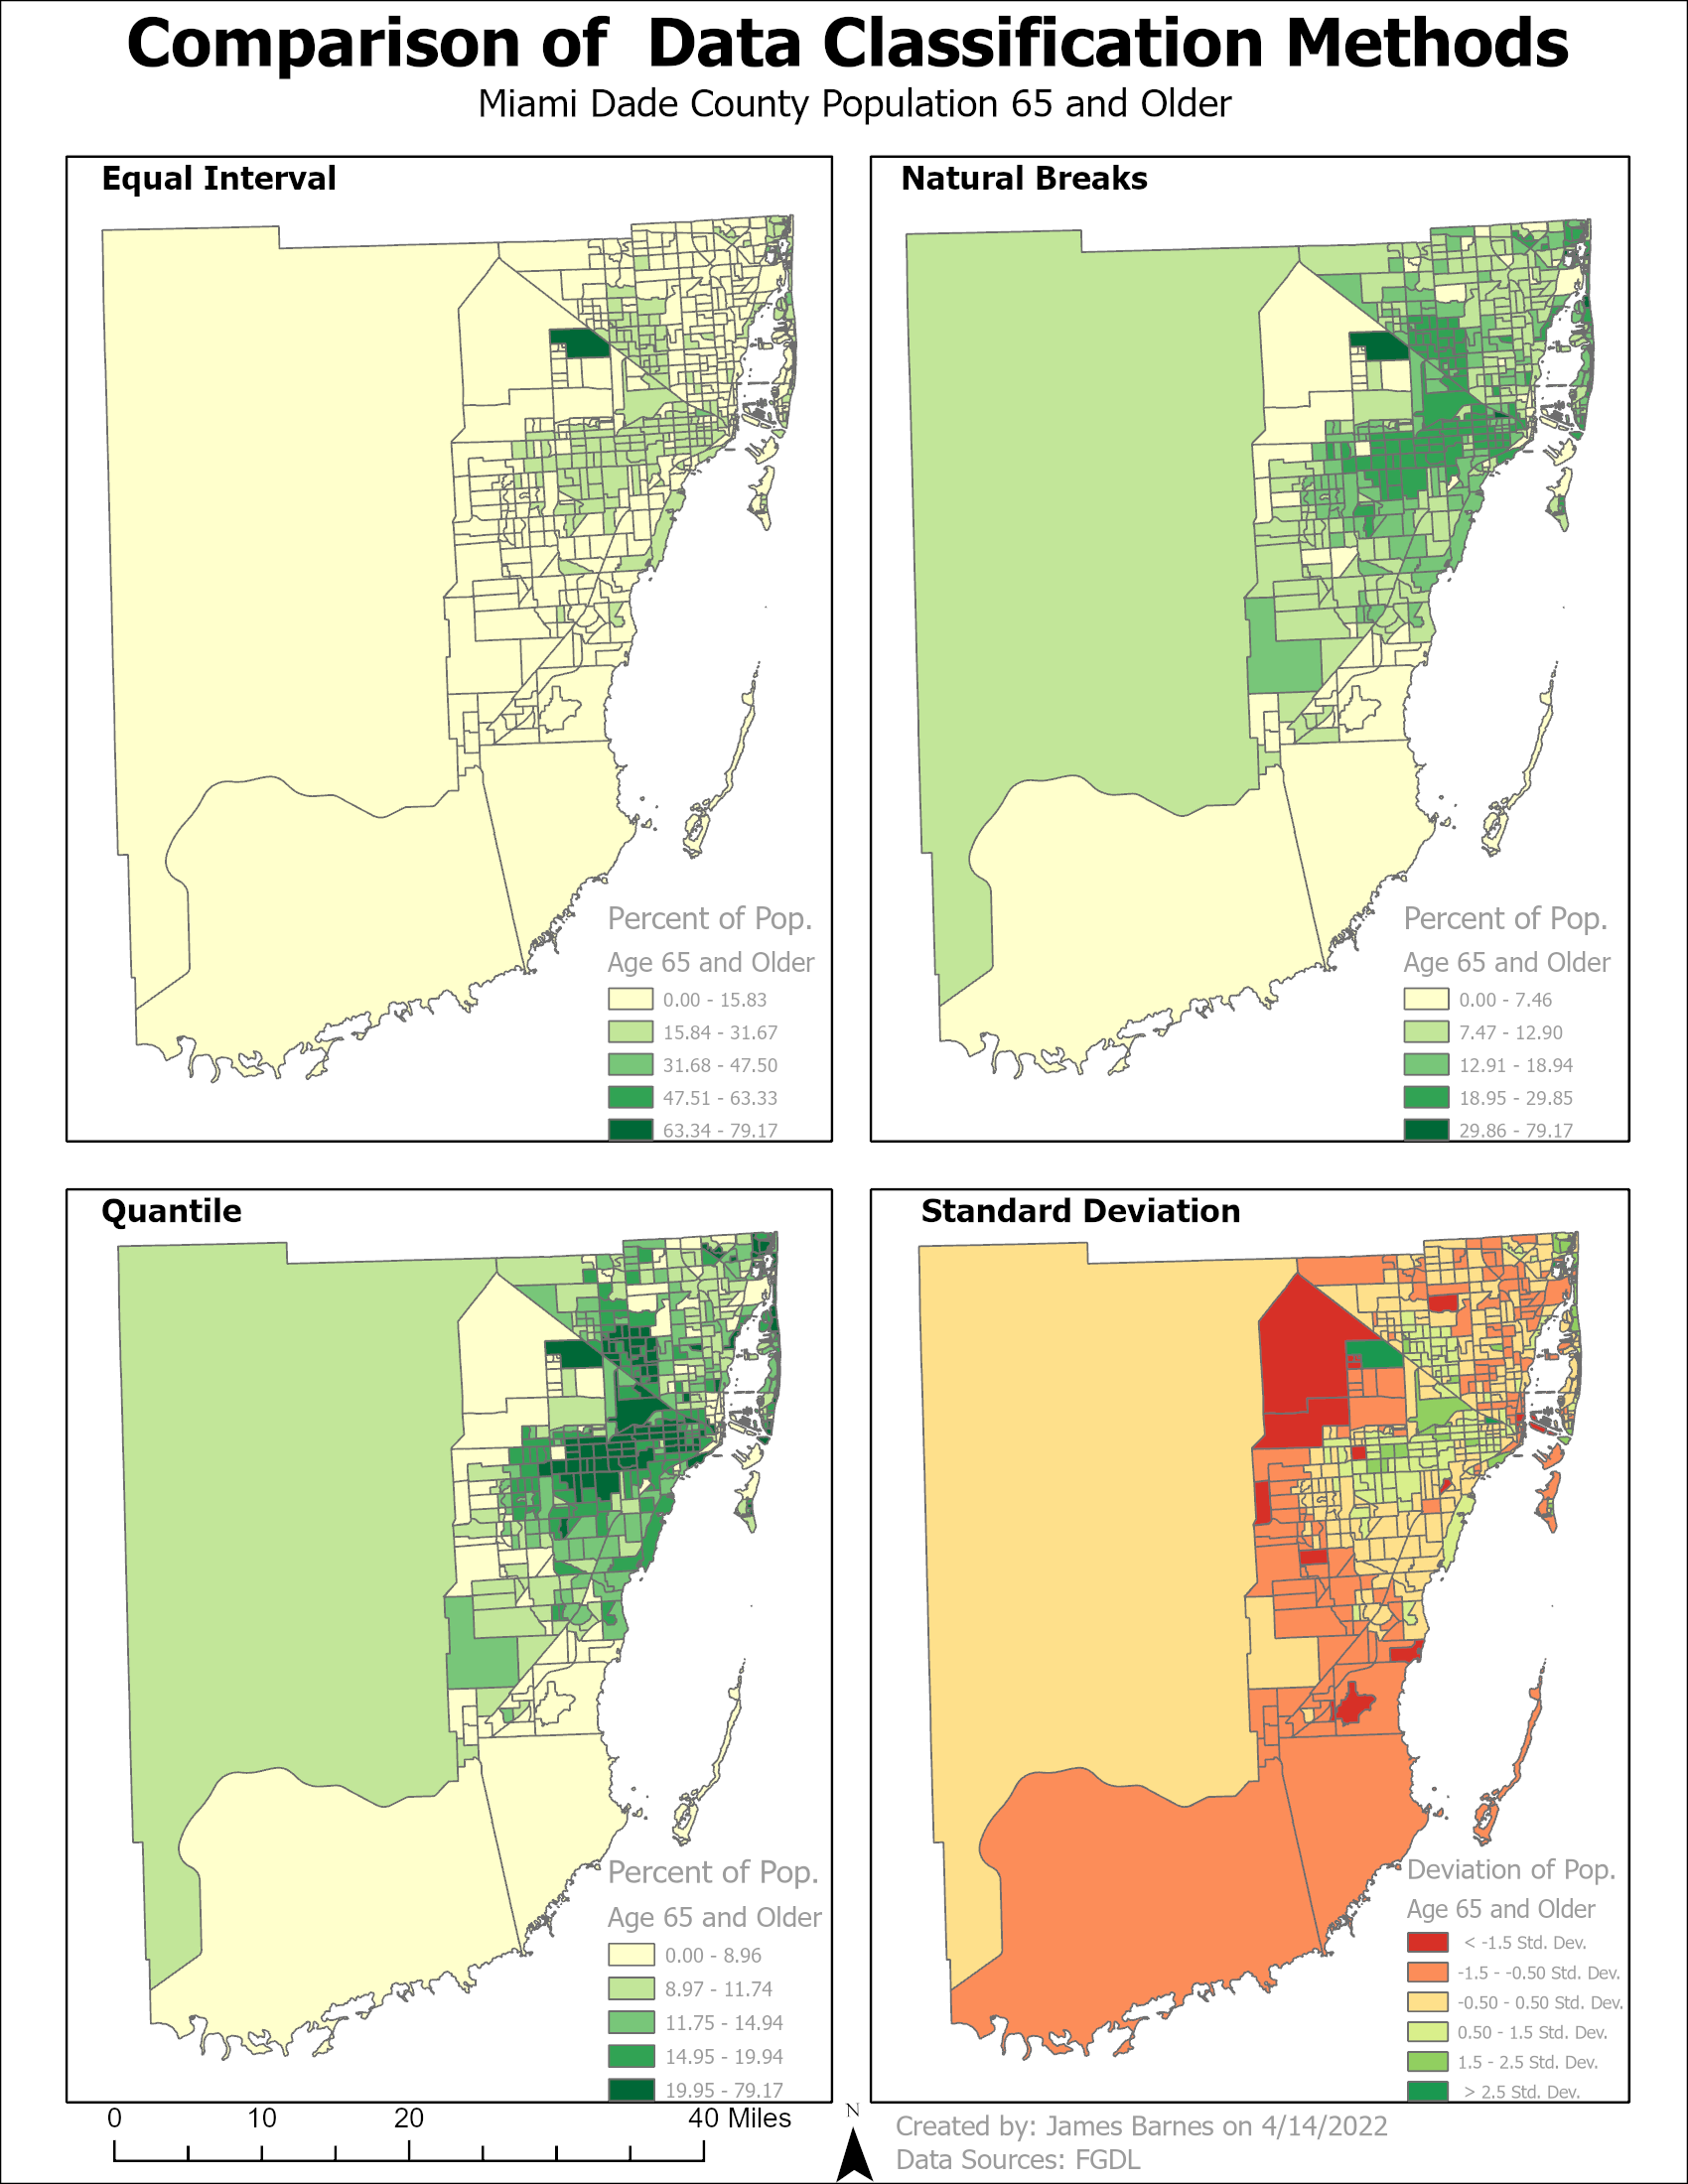
For this Module we worked on using different types of data classification specifically Equal Interval, Natural Breaks, Standard Deviation, and Quantile. We learned the pros and cons of each classification type and how they affect the data when displayed on the maps below. We created two maps based on the senior (age 65 and up) population of Miami Dade county one that showed the four classifications with just the percentage of the target demographic in each census tract and the other normalized by area to show the concertation of the targeted group in the county and how each classification affected it.


.png)
No comments:
Post a Comment