.png)
.png)
.png)
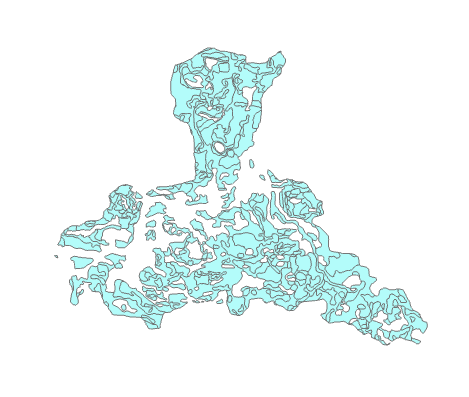
In this Lab I worked with scripting with raster data in Spyder and in ArcGIS Pro. I learned how manipulate raster data to show on a map certain features and display changes in elevation. For this particular lab one of the main objectives was to highlight certain criteria in the data. For example the landcover, slope, and aspect each had specific ranges that were determined to be important enough to be shown. In order to accomplish this the licensing in ArcGIS Pro had to be correctly set to allow for Spatial analyst to be used. Additionally several functions had to used to manipulate the data such as the reclassify function and using map algebra to get the slope and aspect correctly displayed. The results are as seen above as all the criteria have been combined into a single raster layer that is a different color than the rest of the data that doesn't meet the criteria.
Monday, June 27, 2022
Rasters
In this Lab I worked with scripting with raster data in Spyder and in ArcGIS Pro. I learned how manipulate raster data to show on a map certain features and display changes in elevation. For this particular lab one of the main objectives was to highlight certain criteria in the data. For example the landcover, slope, and aspect each had specific ranges that were determined to be important enough to be shown. In order to accomplish this the licensing in ArcGIS Pro had to be correctly set to allow for Spatial analyst to be used. Additionally several functions had to used to manipulate the data such as the reclassify function and using map algebra to get the slope and aspect correctly displayed. The results are as seen above as all the criteria have been combined into a single raster layer that is a different color than the rest of the data that doesn't meet the criteria.
Wednesday, June 22, 2022
Geometries
.png)
.png)
For this lab I learned about geometries and how to manipulate them. In this specific lab I created a script that created a text file and took specific attributes from the feature and added them to a text file. In general this lab seemed simple but it had a lot of intricate things to do to get this correct script. For example nested loops had to be used to get the x and y coordinates which are within several layers of objects in the data. Though I struggled the most with indentations and having indentations that were incorrect would drastically affect the outcome. In my code I had this error and only one of the 247 lines that were to be added to the text file show up and once I corrected the indentations all the lines were correctly added.
Wednesday, June 15, 2022
Explore & Manipulate Data
.png)
.png)
.png)

In this lab we worked extensively with manipulating data. To begin I created a new geodatabase and copied features from one database to another and change the name which was really simple. After that I created a list from the data that had been transferred and I manipulated it in several ways the first was to list the data from a single shape file by its features and I used several variables and a search cursor and a for function to go over the list then filter by the criteria and print the results. Then I was tasked with creating a dictionary for the data and filling it with the data gathered based on the required criteria. In order to accomplish this is I used a search cursor again with a for function to display only the features of the data in the dictionary.
Monday, June 6, 2022
Module 3 Geoprocessing


For this lab I worked with several methods of using geoprocessing tools. The first method was to use the tools in a model builder in ArcGIS Pro as you can see in the first two images. The first image is the actual model and as you can see it is separated into three distinct sections such as the input data in blue, the tool in yellow, and the output in green. These models are visualization of the geoprocessing tools like clip and buffer that show you the flow of data. The actual map data can be delayed or activated immediately after the model has been created. Though you can also create the same effect with scripts as in the third image which I was able to generate a script that added XY coordinates to a shapefile and a buffer that dissolved into a single layer. So from this module I learned how to use geoprocessing tools in two different ways to produce the same analysis as the normal toolbox tools in ArcGIS Pro and I learn the scripting behind them that makes them run properly.
Subscribe to:
Comments (Atom)
LAB 6 Scale Effect and Spatial Data Aggregation
In regards to the effects of scale on vector data I learned that as the larger the scale the larger the units that are measured come out to ...

-
.png) During this lab I worked with DEMs and TINs in ArcGIS Pro. I learned about the difference between DEM and TIN where I learned that TINs are ...
During this lab I worked with DEMs and TINs in ArcGIS Pro. I learned about the difference between DEM and TIN where I learned that TINs are ... -
 In this lab we worked with Isarithic Maps. More specifically we created a map that showed the annual precipitation and how it relates to el...
 -
.png) For this lab I worked on the ability to use GIS accurately assess coastal flooding through several methods of analysis. In general we used...
For this lab I worked on the ability to use GIS accurately assess coastal flooding through several methods of analysis. In general we used...